Software engineering KPIs
Contents

What would be a good set of key performance indicators for engineering projects and teams? We’re usually accustomed to see KPIs in a business context, and more used by sales, marketing, product squads. But I believe that the exercise of figuring out KPIs is very important. We’re talking about measuring our performance with simple numbers. Is that possible at all?
If we do figure it out, we’d have some kind of software development metrics dashboard. That would have value by itself. We could see were we’re at, we’re we going and the impact or correlation between KPIs,
But it’s very difficult to measure productivity in software engineering teams. Having the work mostly being creative makes the modeling it as numbers pretty tricky. We may look to KPIs that only reflect volume, but neglect to consider added value. The typical lines of code metric comes to mind.
I started this exercise by trying to focus KPIs in terms of added value and things that slow us down.
What’s the endgame?
The value I see in KPIs is mostly regarding the future. If we can use past data to have a glimpse of what’s ahead we can act today on it. This forecasting approach really depends on having KPIs. Let’s for example consider a “Number of Releases” KPI (or deploys to production). We can assume that more releases are better. They add value to the business. If we look to the past months and chart our releases we can come up with a formula for predicting what’s ahead. For example, if the average per month is 3 releases, then we could assume that the next months we’d always have 3 releases per month.
And with this equation we’d be able to see how many releases we’d have accomplished by the end of the year. Now this is guessing. But having this formula allows us to change it to contemplate optimistic and pessimist scenarios. And then we’d have target window.
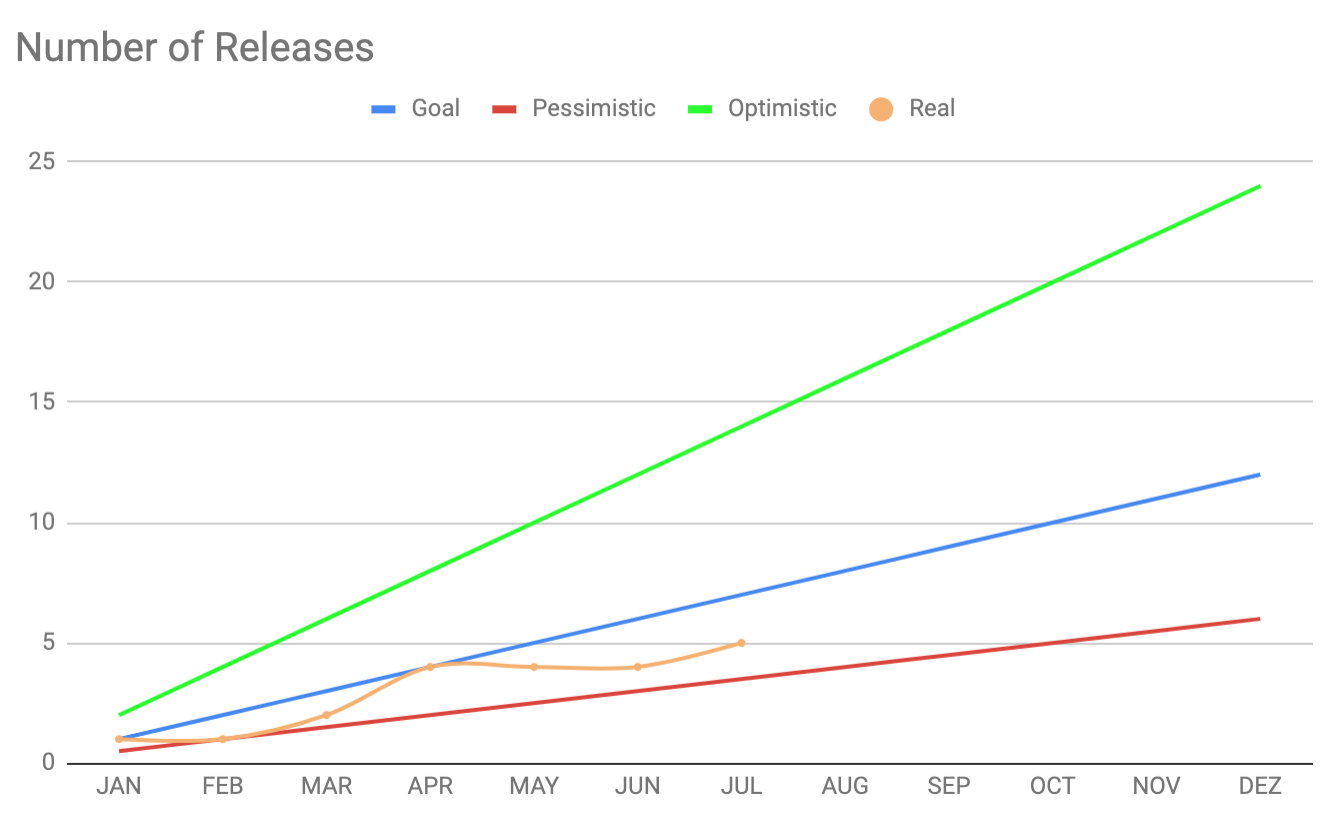
This chart shows that window. It has the optimistic, pessimistic and goal lines. And then it has our current situation. We can see that we’re currently bellow our goal. We’d need to adjust our process/strategy or expectations.
By putting other metrics on the same chart we could find some correlation. How does changing developers impact other KPIs? We may deliver more during crunch time, but how is our added vale impacted by it afterwards? And by using data we can start to see other types of trends and better understand what makes us tick.
Examples of software engineering KPIs
By now I’m convinced that tracking and analysing these KPIs adds value. But I still don’t know what KPIs to pick. Following a decision log process, I’ll try to define some and then come back to verify if they’re adding value or not.
Added value
- Number of releases - This would be seen as value for other teams or stakeholders. If we only deliver once per year something must be wrong. Sometimes we do have larger releases, but from my experience having more releases is better
- Number of developers - Well, if we add more developers we should have more output right? We know that it’s not that simple. Tracking this allows us to see the impact of adding or removing people, mostly on the other KPIs
- Developer delta - It’s different having a team of 8 developers during an year that didn’t change, than to always have 8 developers but swapping people. How much the team changes would be tracked here
- Number of bugs in production - Less bugs more added value. Naturally there’s the question of bug severity. Is it that bad to have tons of low priority bugs when we’re focusing on adding value? That’s always a heated debate. This metric will help teams following a zero bug policy
Pull requests
- Time to close a PR - There are many things that affect the merging of a PR. I’d say that being able to close a PR fast is a good sign. When a developer is waiting for a PR there may be idleness or ping pong or waiting for dependencies
- Time from PR closed to production - When we do merge a PR, how much time does it take to reach production? This can be very fast if we auto deploy on merge, but may be slower if we need a formal QA process.
- Number of comments per PR - This one also affects the time to close a PR. But may add more information to it. If we have lots of comments in average on a PR that is an indicator that something may be wrong. We may have an alignment issue on the team that generates discussions or lots of corrections. This can add to the submitter’s frustration. On the other hand if we have close to zero comments per PR, it may hint that we’re not having PRs deeply reviewed
Kind of related:
- Pipeline build time - This affects the time to close a PR. Ideally we’d have our feedback instantaneously. If we have a pipeline that takes hours it will impact our productivity. Also interesting would be to see how the build time increases over time, and the impact of adding more developers, more tests, more features, etc
- Number of times master build fails - Having master always green brings confidence to the team and to the process. If on the other hand we have lots of failures, for example because of flaky tests, that will impact our trust and performance
Infrastructure
- Average downtime - If the application is down, we’re not adding value. We should track this and try to understand what impacts it
- Number of production incidents - How many times we have problems in production that require someone to assess and fix them right away
- Running costs - This could be a whole section by itself, and split in categories like development tooling (build minutes, productivity tools) and environment costs (AWS, services that check for uptime, etc)
- Cost per user - This would be the running cost by the total users/accounts on the system. With this we could forecast what would be our cost if the other teams achieve their target KPIs for new users/accounts
- Sizing - Related to the previous. How much processing power do we need to support the current usage? How much more will we need to support the usage one year from now?
- Performance benchmarks - How much does our system currently endure? For example for a given setup how many transactions per second can we handle? This may harder to track on a KPI
Looking back…
Is it good one month later?
Still trying it out…
Is it good 6 months later?
Work in progress…
Summary
Ultimately KPIs will be custom for each team. Some teams may want to track story points or delivered epics. It’s important to focus on added value and run away from vanity metrics. But I do realise that some times is hard to distinguish between the two. KPIs is another process that we need to incorporate. This means that someone needs to do the tracking or implement data gathering. So it should be adding value by itself. If we just have a bunch of numbers but we don’t use them to make informed decisions, we’re missing out.
Discussion and references